Introduction:
This objective of this exercise was to create two navigation maps for use in later field exercises. The maps reference the priory, which is a piece of land owned by UW-Eau Claire that includes over 100 acres of mostly wooded land. It has a number of buildings as well, that are utilized by UW-Eau Claire for academics and a child care program.
See this link for a map referencing the UWEC Priory
It is important to include in navigational maps all of the tools that are necessary to perform the required task. Navigation maps need to be able to be relied upon to represent the real world features to a workable extent, so we had some explicit instructions on what to include.
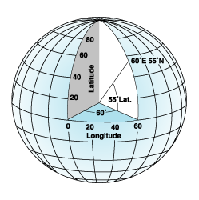
Two different types of coordinate systems were used in this exercise. The first is a geographic coordinate system, which uses a 3D sphere to define locations on earth using degrees. This is what comprises our latitude/longitude system.
 |
| This image demonstrates the world as a globe, showing how longitude and latitude values are calculated (with respect to the equator and the prime meridian). |
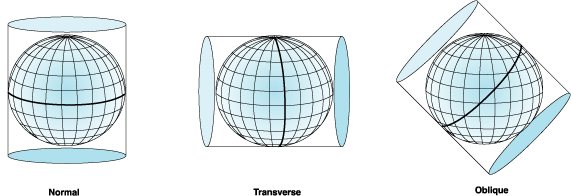
The other type of coordinate system we used is the Universal Transeverse Mercator projected coordinate system. The term projected, means that this model takes a 3D model of the earth, and puts it onto a 2D surface. Because of it's 2D characteristics, projected coordinate systems have constant lengths, angles, and areas- where in a geographic coordinate system, distance these measurements fluctuate based on distance from the equator. However, projected coordinate systems always include a certain degree of error, simply because they aim to represent a 3D feature (the earth) in two dimensions. This results in stretching at the boundaries of the projection, but much research has been done to optimize different projections for use in different geographic areas to reduce error. The projection to be used in this study is Transverse Mercator, which is a cylindrical projection (meaning the earth is essentially placed inside a cylinder and rolled from pole to pole. Thus, the center of the model is the most accurate, with stretching occurring to the sides). Because of this, different zones are defined, with the cylinder touching the globe at various different points- this is the Universal Transverse Mercator System.
Because geographic coordinate systems are often optimized for smaller scale studies, we were instructed to create two different maps, one using a geographic coordinate system, and the other in UTM. Using this UTM projection, we are able to use meters as our working units, which is often preferable for land surveys.
Methods:
The first component to this exercise was to calculate our pace count. A pace count is a simple but surprisingly valuable tool for use in navigation. With it, you can calculate distance between features without requiring expensive tools like GPS devices, or lasers. For calculating our pace count however, we did use expensive devices. We went out to the parking lot and equipped a couple of students with sonic distance finder, and a laser distance finder. We then had another student walk 100 meters down with a receiver. We marked the exact distance to the 100 meter point, and had each student walk down, counting every time his/her dominant foot fell. I count 65 on my way down, and then 63 on the way back. Averaging these figures gives me a pace count of 64, which I will be using for all further calculations.
With our pace count calculated, the next step was to create our navigation maps. Professor Joe Hupy gave us an introduction to the priory, and instructed us on necessary components for our maps. First and foremost, our maps needed to have a workable grid system that is useful for calculating distance and referencing features. This is achieved through ESRI ArcMap's layout view grids. There are a number of options for the layout and setup of these grids, and it took some fiddling to get a usable grid for reference. For the UTM grid, I used 50 meter increments. For the latitude/longitude map, I used a decimal degrees grid, incrementing by .001 degrees. We were provided with aerial imagery of our study area, within which, we had an area designated for containing the points that we would be surveying later on. All data in this exercise was compiled by Joe Hupy and is located in a departmental priory geodatabase. Other important feature that we included in our navigation maps was the terrain information. Where the aerial imagery provides a good overview of the land surface features, it doesn't show topography very well. Because of this, I included 5 meter contour lines with labels to represent the changes in elevation for use in the field. Also, like any other map, ours were required to include a scale bar, scale text, north arrow, and title- along with relevant metadata (like coordinate system and projection information). The final maps are shown below. They were created in ESRI ArcMap, and finishing touches were added through the use of Adobe Illustrator.
With our pace count calculated, the next step was to create our navigation maps. Professor Joe Hupy gave us an introduction to the priory, and instructed us on necessary components for our maps. First and foremost, our maps needed to have a workable grid system that is useful for calculating distance and referencing features. This is achieved through ESRI ArcMap's layout view grids. There are a number of options for the layout and setup of these grids, and it took some fiddling to get a usable grid for reference. For the UTM grid, I used 50 meter increments. For the latitude/longitude map, I used a decimal degrees grid, incrementing by .001 degrees. We were provided with aerial imagery of our study area, within which, we had an area designated for containing the points that we would be surveying later on. All data in this exercise was compiled by Joe Hupy and is located in a departmental priory geodatabase. Other important feature that we included in our navigation maps was the terrain information. Where the aerial imagery provides a good overview of the land surface features, it doesn't show topography very well. Because of this, I included 5 meter contour lines with labels to represent the changes in elevation for use in the field. Also, like any other map, ours were required to include a scale bar, scale text, north arrow, and title- along with relevant metadata (like coordinate system and projection information). The final maps are shown below. They were created in ESRI ArcMap, and finishing touches were added through the use of Adobe Illustrator.
Discussion:
This exercise required us to be proactive about setting up a map that is usable in the field. It requires us to think critically about what features the navigation map needs to provide, and what reference system will be effective. The next step is to meet with our groups and discuss each of our maps, and decide on one group members' that we think will be most effective for navigational purposes in the field. This not only allows us to check each others' maps for errors, it allows us to decide which grid system we are most comfortable using as a group, and gives us the opportunity to collaborate the best features from each of our maps into one, usable and effective navigation tool. Ultimately, we don't know how these maps will work, it will take trial and error to decide whether the maps and the data they include are sufficient for field research.
Conclusion:
This exercise was valuable because it required us to think critically about our needs for upcoming studies at the Priory. It also gave us a good introduction to the Priory itself, and allowed us to begin thinking about our methods that we'll use later on in the field- using the very same maps we created in this exercise! Understanding the grid system in ESRI ArcMap is important, especially in creating navigation maps, and this exercise gave me the ability to confidently set one up for future purposes. It also required me to review the concepts of geographic coordinate systems, projected coordinate systems, and the UTM projection system. These ideas are fundamental in geospatial technology, and it is always good practice to provide information on them at every opportunity.


No comments:
Post a Comment